Independent Samples T-Test using SPSS

Independent Samples T Test

Independent Samples T-Test using SPSS

This post focuses on how Independent Samples T-Test. The concept of Independent Samples T-Test, How to Run, Interpret and Report the text. Independent Samples T-Test belong to the family of Tests to Compare Means.

The Concept

An independent sample t-test is used when you would want to compare means score between two different groups for one continuous variable. Following are few appropriate situations where you could use independent samples t-test.  

Examples

Following are few examples scenarios in which one should run independent samples t-test

  • A teacher wants to know if there are significant differences in marks obtained in the subject Business Research by students of two sections.
  • A manager would like to know if there are differences in morale for male and female employees
  • A marketer would like to know if buying behavior of people of two cities is same or different.
  • An educationist wants to investigate if Teachers satisfaction varies between school and college teachers.

In each of the above mentioned scenarios we could easily see that data is collected on one continuous variable (Marks Obtained, Morale, Buying Behavior, Teachers Satisfaction), however it is collected from two different groups (Two Sections, Male & Female, Two Cities, School & College) that are then compared using Independent sample t-test.

Assumptions

Your data must meet the following requirements:

  • Dependent variable that is continuous (i.e., interval or ratio level)
  • Independent variable that is categorical (i.e., two groups)
  • Independent samples/groups (i.e., independence of observations)
    • There is no relationship between the subjects in each sample. This means that:
    • Subjects in the first group cannot also be in the second group
    • No subject in either group can influence subjects in the other group
    • No group can influence the other group. Violation of this assumption will yield an inaccurate p value
  • Normal distribution (approximately) of the dependent variable for each group
    • Non-normal population distributions, especially those that are thick-tailed or heavily skewed, considerably reduce the power of the test
    • Among moderate or large samples, a violation of normality may still yield accurate p values

How to Run in SPSS

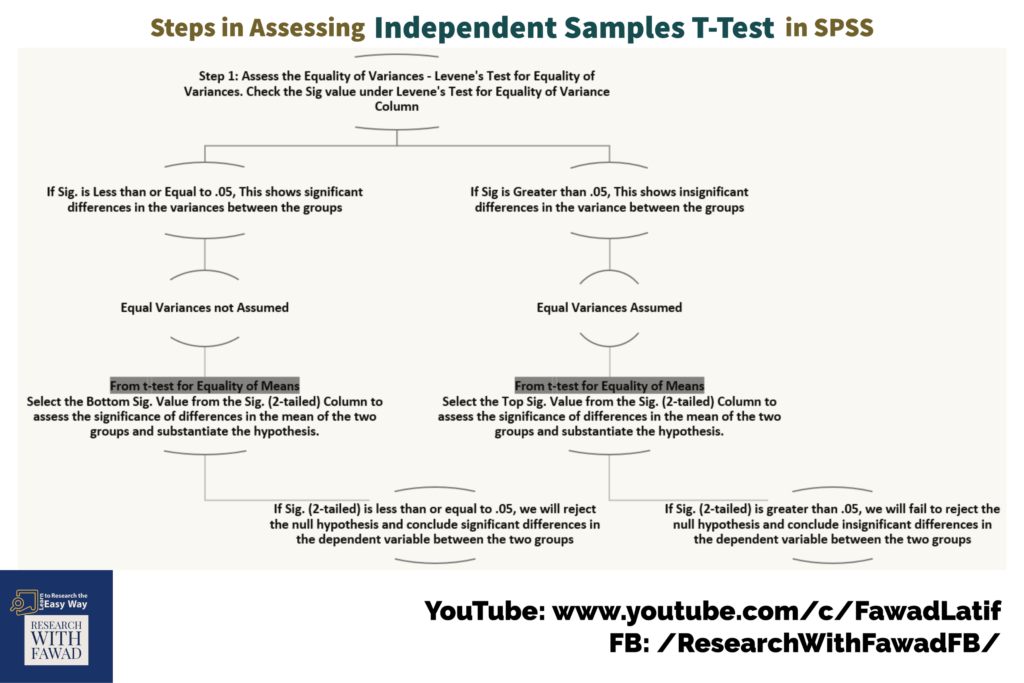
Step 1: In SPSS Go to Analyze -> Test to Compare Means -> Independent Samples T-Test

Menu Location for Independent Samples T-Test

Step 2: Select the Continuous (Dependent Variable) from the variables list on the left and click Arrow to add it to the Test Variables(s): list box

Independent Samples T-Test Dialog Box

Step 3: Next, add the Grouping variable (In this Case Gender) to the Grouping Variable: Box by first selecting the variable Gender from the List of Variables on the left and then clicking the arrow button right before the Grouping Variable: textbox.

Add Grouping Variable in Independent Samples T-Test

Step 4: Click Define Groups button and you see the following dialog box to define the groups. In this case Male is represented by 1 and Female is represented by 2.

Define Groups in Independent Samples T-Test

Step 5: Click Continue and then Press OK to display the results in the output. You will see the results similar to one shown below in in the output window

Independent Samples T-Test Results

Template to Reporting Independent Sample T-Test

Here are two templates to report Independent Samples-Test.

For Insignificant Results

  • An independent-samples t-test was conducted to compare the [Add Criterion Variable Here] for [Group1] and [Group 2]. There were [no]significant differences (t (df) = _____, p = _____) in scores for [Group1] (M = _____, SD = _____) and [Group 2] (M = _____, SD = _____). The magnitude of the differences in the means (mean difference = ______, 95% CI: ______ to ______) was very small. Hence, H1 was not supported.

For Significant Results

  • An independent-samples t-test was conducted to compare the [Add Criterion Variable Here] for [Group1] and [Group 2]. There were significant differences (t (df) = _____, p = _____) in the scores with mean score for [Group1] (M = _____, SD = _____) was higher/lower than and [Group 2] (M = _____, SD = _____). The magnitude of the differences in the means (mean difference = ______, 95% CI: ______ to ______) was significant. Hence, H1 was supported.

Reporting Independent Sample T-Test

Here i have reported the results presented earlier for Independent Samples T-Test.

H1: There is a significant difference in Customer Loyalty (CL) between Male and Female Respondents

H1: There is a significant difference in Customer Loyalty (CL) between Male and Female Respondents


An independent-samples t-test was conducted to compare the CL for Male and Female. There were significant differences (t (772) = 2.470, p = 0.014) in the scores with mean score for Male (M = 3.92, SD = 0.70) was higher/lower than and Female (M = 3.80, SD = 0.70) (See Table 1). The magnitude of the differences in the means (mean difference = 0.12, 95% CI: 0.025 to 0.225) was significant. Hence, H1 was supported.

Table for Reporting Independent Samples T-Test


ISteps

Steps in Asessing Independent Samples T Test

Video