
Understanding Indicator and Construct Reliability.
Understand the Concept and Evaluation of Indicator Reliability and Construct Reliability using SmartPLS4.
Understanding Indicator and Construct Reliability.
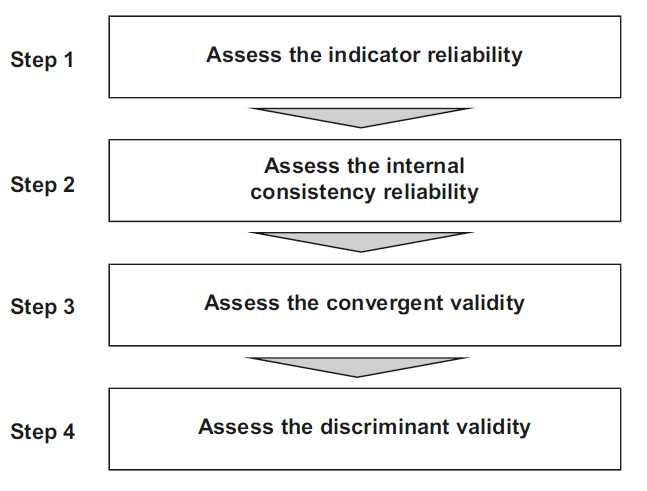
This session discusses in detail the concept of Indicator Reliability and Construct Reliability. The statistics are assessed as part of the measurement model. Most often, the constructs are reflective at lower level. Hence, all the lower order constructs in the study are assessed for reliability and validity. The following figure highlights the steps in measurement model assessment.
What is Indicator Reliability?
In the realm of construct reliability assessment, the initial step involves scrutinizing the extent to which each indicator’s variance is elucidated by its corresponding construct. This serves as a pivotal aspect of reflective measurement model evaluation. To gauge the reliability of each indicator, we examine the extent to which its variance is explained by the construct. This is a manifestation of indicator reliability.
The initial step in reflective measurement model assessment involves scrutinizing indicator reliability. Within reflective models, indicators point toward the latent construct, as depicted by the arrows. For a reflective model, characterized by arrows pointing towards the indicators, and reflective constructs, denoted by arrows aligning with the indicators, understanding the reliability of indicators is paramount.
To compute this, we square the loadings obtained from earlier discussions, which represent the bivariate correlation between the indicator and the construct. An indicator loading exceeding 0.708 is recommended, indicating that over 50% of the indicator’s variance is explained by the construct, thus establishing acceptable indicator reliability.
Indicator reliability, a concept rooted in the evaluation of how much variance in each indicator is explicated by the latent construct, necessitates the computation of an indicator’s explained variance. Indicator reliability is the square of a standardized indicator’s indicator loading. It represents how much of the variation in an item is explained by the construct and is referred to as the variance extracted from the item. The loading represents the bivariate correlation between the indicator and the construct, underscoring the essence of the indicator’s reliability.
Indicator loadings above 0.708 are recommended, since they indicate that the construct explains more than 50 percent of the indicator’s variance, thus providing acceptable indicator reliability. The calculation of indicator reliability can be performed by squaring the values in the indicator/factor loading. The squared value >= 0.50 indicates the indicator reliability is established. To summarize, if the indicator loading attains or exceeds 0.708, it implies that 50 percent of the indicator’s variance is accounted for by the construct, thereby affirming acceptable indicator reliability.
In case you obtain weaker indicator loadings (< 0.708) . Do not simply delete the indicators when their loading is below 0.70, researchers should carefully examine the effects of indicator removal on other reliability and validity measures. Generally, indicators with loadings between 0.40 and 0.708 should be considered for removal only when deleting the indicator leads to an increase in the internal consistency reliability or convergent validity above the suggested threshold value.
Another consideration in the decision of whether to delete an indicator is the extent to which its removal affects content validity. Moreover, content validity assumes significance in deciding whether to retain or eliminate an indicator. Items affecting content validity warrant careful scrutiny, and indicators with very low loadings (below 0.40) merit exclusion from the measurement model.
In conclusion, a meticulous evaluation of indicator reliability forms an integral part of reflective measurement model assessment. It involves a nuanced understanding of loadings, thresholds, and the interplay between constructs and indicators. For further insights into reliability considerations, additional resources can be explored.
Video: Concept and Assessment of Indicator Reliability
What is Construct Reliability?
In this tutorial, we delve into the critical process of evaluating the construct reliability within the measurement model, specifically employing the Smart PLS 4 software.
Construct reliability is a form of reliability used to judge the consistency of results across items on the same test. It determines whether the items measuring a construct are similar in their scores (i.e., if the correlations between items are strong). Internal consistency reliability is the extent to which indicators measuring the same construct are associated with each other.
The subsequent phase involves evaluating internal consistency reliability for the construct. In reflective measurement model assessment, composite reliability (rho_c) is a primary measure in PLS-SEM. Higher values exceeding 0.70 are deemed reliable, with 0.60 to 0.70 considered acceptable in exploratory research. Values ranging from 0.70 to 0.90 indicate satisfactory to good reliability. Caution is warranted for values surpassing 0.90, as they suggest redundancy among indicators, potentially compromising construct validity. Cronbach’s alpha serves as an alternative measure, mirroring the thresholds of composite reliability. However, it assumes uniform indicator loadings, unlike the more flexible composite reliability. Striking a balance between the conservative Cronbach’s alpha and liberal composite reliability is the reliability coefficient rho_a, offering a nuanced perspective on the construct’s true reliability.
To obtain these reliability metrics in Smart PLS 4, navigate to the “Quality Criteria” section, specifically “Construct Reliability and Validity.” The overview provides insights into composite reliability, Cronbach’s alpha, and the reliability coefficient rho_a, aiding researchers in ensuring the robustness of their measurement model. For detailed results, exporting to Excel is recommended before incorporating them into the final document. This comprehensive tutorial guides researchers through the intricate process of assessing and enhancing construct reliability, offering invaluable insights for rigorous research endeavors.
Reference
Hair Jr, J. F., Hult, G. T. M., Ringle, C. M., Sarstedt, M., Danks, N. P., & Ray, S. (2021). Partial least squares structural equation modeling (PLS-SEM) using R: A workbook.
To Download the Book, Click Here
This book is licensed under the terms of the Creative Commons Attribution 4.0 International
License (http://creativecommons.org/licenses/by/4.0/)
License (http://creativecommons.org/licenses/by/4.0/)
Videos: Concept and Assessment of Construct Validity
Additional SmartPLS 4 Tutorials
- A Basic and Simple Model in SmartPLS4
- Basic SEM Concepts – Convergent and Discriminant Validity
- Basic Structural Equation Modelling (SEM) Concepts
- Categorical Moderation Analysis using SEMinR
- How to Assess Convergent Validity (Construct validity)
- How to Assess Discriminant Validity (Construct validity)
- How to Assess Reflective-Reflective Higher Order Construct
- How to Design a Measurement Model?
- How to Enter Data in SPSS or Excel
- How to Solve Discriminant Validity Issues
- How to Use Necessary Condition Analysis in SmartPLS4?
- Reflective-Formative Higher-Order Model using SmartPLS4
- Simple Structural Model in SmartPLS4
- SmartPLS4 Tutorials Series Introduction
- Steps in Data Analysis
- What is a Formative Construct?