
How to Design, Analyze, and Report a Measurement Model in SmartPLS4?
I have collected the Data, How do i start the Data Analysis?
If you have collected the data and would like to start data analysis using SmartPLS. The tutorial can help in clearing any confusion.
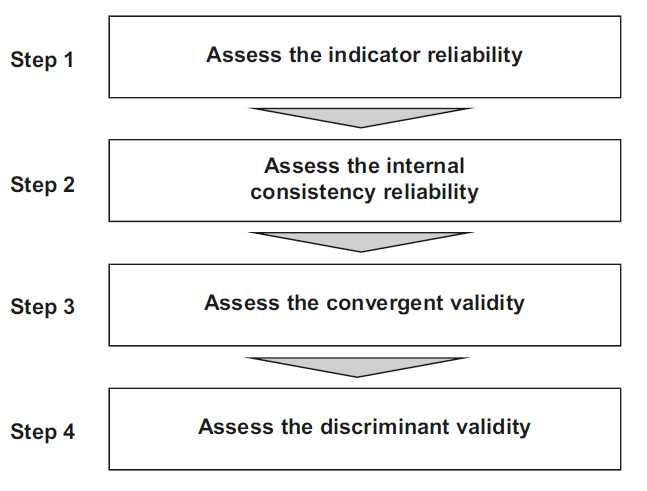
Once a scholar has collected the data and intends to use Structural Equation Modelling (SEM) based tools, for instance SmartPLS. The first steps is to assess the reliability and validity of the constructs (variables) in the study. To do so, the scholar has to design a measurement model. Assessment of Measurement model is divided into 4 steps.
Figure illustrates the reflective measurement model evaluation process.
How to Design and Analyze a Measurement Model in SmartPLS 4?
This tutorial describes how to evaluate the quality of reflective measurement models estimated by PLS-SEM, both in in terms of reliability and validity.
Assessing reflective measurement models includes evaluating the reliability of measures, on both an indicator level (indicator reliability) and a construct level (internal consistency reliability). Validity assessment focuses on each measure’s convergent validity using the average variance extracted (AVE). Moreover, the heterotrait–monotrait (HTMT) ratio of correlations allows to assess a reflectively measured construct’s discriminant validity in comparison with other construct measures in the same model.
Step 1: Indicator Reliability
The first step in reflective measurement model assessment involves examining how much of each indicator’s variance is explained by its construct, which is indicative of indicator reliability.
To compute an indicator’s explained variance, we need to square the indicator loading, which is the bivariate correlation between indicator and construct. As such, the indicator reliability indicates the communality of an indicator.
Indicator loadings above 0.708 are recommended, since they indicate that the construct explains more than 50 percent of the indicator’s variance, thus providing acceptable indicator reliability.
Researchers frequently obtain weaker indicator loadings (< 0.708). Rather than automatically eliminating indicators when their loading is below 0.70, researchers should carefully examine the effects of indicator removal on other reliability and validity measures.
Generally, indicators with loadings between 0.40 and 0.708 should be considered for removal only when deleting the indicator leads to an increase in the internal consistency reliability or convergent validity (discussed in the next tutorials) above the suggested threshold value. Another consideration in the decision of whether to delete an indicator is the extent to which its removal affects content validity
Step 2: Assess Internal Consistency Reliability
The second step in reflective measurement model assessment involves examining internal consistency reliability. Internal consistency reliability is the extent to which indicators measuring the same construct are associated with each other.
One of the primary measures used in PLS-SEM is composite reliability rhoc. Higher values indicate higher levels of reliability.
Cronbach’s alpha is another measure of internal consistency reliability. For example, reliability values between 0.60 and 0.70 are considered “acceptable in exploratory research,” whereas values between 0.70 and 0.90 range from “satisfactory to good.” Values above 0.90 (and definitely above 0.95) are problematic, since they indicate that the indicators are redundant, thereby reducing construct validity.
Step 3: Assess Convergent Validity
The third step is to assess (the) convergent validity of each construct. Convergent validity is the extent to which the construct converges in order to explain the variance of its indicators. The metric used for evaluating a construct’s convergent validity is the average variance extracted (AVE) for all indicators on each construct.
The AVE is defined as the grand mean value of the squared loadings of the indicators associated with the construct (i.e., the sum of the squared loadings divided by the number of indicators). Therefore, the AVE is equivalent to the communality of a construct. The minimum acceptable AVE is 0.50 – an AVE of 0.50 or
higher indicates the construct explains 50 percent or more of the indicators’ variance that make up the construct.
Step 4: Assess Discriminant Validity
Fornell & Larcker Criterion (1981)
Fornell and Larcker (1981) proposed the traditional metric and suggested that each construct’s Square root of AVE (squared variance within) should be compared to the inter-construct correlation (as a measure of shared variance between constructs) of that same construct and all other reflectively measured constructs in the structural model – the shared variance between all model constructs should not be larger than their AVEs. Hence, a higher square root of AVE of a construct when compared to the correlation of that construct with all the other constructs in the study establishes discriminant validity.
Heterotrait-Monotrait (HTMT) Ratio
As a better alternative to Fornell and Larcker (1981) Criterion, the heterotrait–monotrait ratio (HTMT) of correlations (Henseler et al., 2015) is recommended to assess discriminant validity. The HTMT is defined as the mean value of the indicator correlations across constructs (i.e., the heterotrait–heteromethod correlations) relative to the (geometric) mean of the average correlations for the indicators measuring the same construct (i.e., the monotrait–heteromethod correlations).
Discriminant validity problems are present when HTMT values are high. Henseler et al. (2015) propose a threshold value of 0.90 for structural models with constructs that are conceptually very similar. When constructs are conceptually more distinct, a lower, more conservative, threshold value is suggested, such as 0.85 (Henseler et al., 2015).
Cross-Loadings
Based on the cross-loadings that presents the loadings for each item under all the constructs in the study. The loadings show the loadings of the item under its underlying construct, and what if the item was to load with the other constructs in the study. An item in a construct shall load substantially well onto its own underlying (parent) construct instead of the other constructs in the study.
Videos
How to Report a Measurement Model in SmartPLS 4?
Once, the scholar have designed and analyzed a measurement model. The next step is to report the measurement model results. As part of the reporting, the scholar can follow the same steps as highlighted earlier. The scholars shall report
- Factor Loadings/Indicator Reliability
- Construct Reliability including Cronbach’s Alpha and Composite Reliablity
- Construct Validity including Convergent Validity and Discriminant validity established through Fornell and Larcker Criterion and Heterotrait-Monotrait Ratio.
The video is a step by step guide to report a measurement model in a research paper/thesis.
Video
Reference
Hair Jr, J. F., Hult, G. T. M., Ringle, C. M., Sarstedt, M., Danks, N. P., & Ray, S. (2021). Partial least squares structural equation modeling (PLS-SEM) using R: A workbook.
To Download the Book, Click Here
This book is licensed under the terms of the Creative Commons Attribution 4.0 International
License (http://creativecommons.org/licenses/by/4.0/)
License (http://creativecommons.org/licenses/by/4.0/)
Additional SmartPLS 4 Tutorials
- A Basic and Simple Model in SmartPLS4
- Basic SEM Concepts – Convergent and Discriminant Validity
- Basic Structural Equation Modelling (SEM) Concepts
- Categorical Moderation Analysis using SEMinR
- How to Assess Construct Reliability?
- How to Assess Convergent Validity (Construct validity)
- How to Assess Discriminant Validity (Construct validity)
- How to Assess Reflective-Reflective Higher Order Construct
- How to Enter Data in SPSS or Excel
- How to Solve Discriminant Validity Issues
- How to Use Necessary Condition Analysis in SmartPLS4?
- Reflective-Formative Higher-Order Model using SmartPLS4
- Simple Structural Model in SmartPLS4
- SmartPLS4 Tutorials Series Introduction
- Steps in Data Analysis
- What is a Formative Construct?